Report in the Admin Panel
All running processes in Gamfi People Platform, regardless of their current status, can be found in the "Processes" tab.
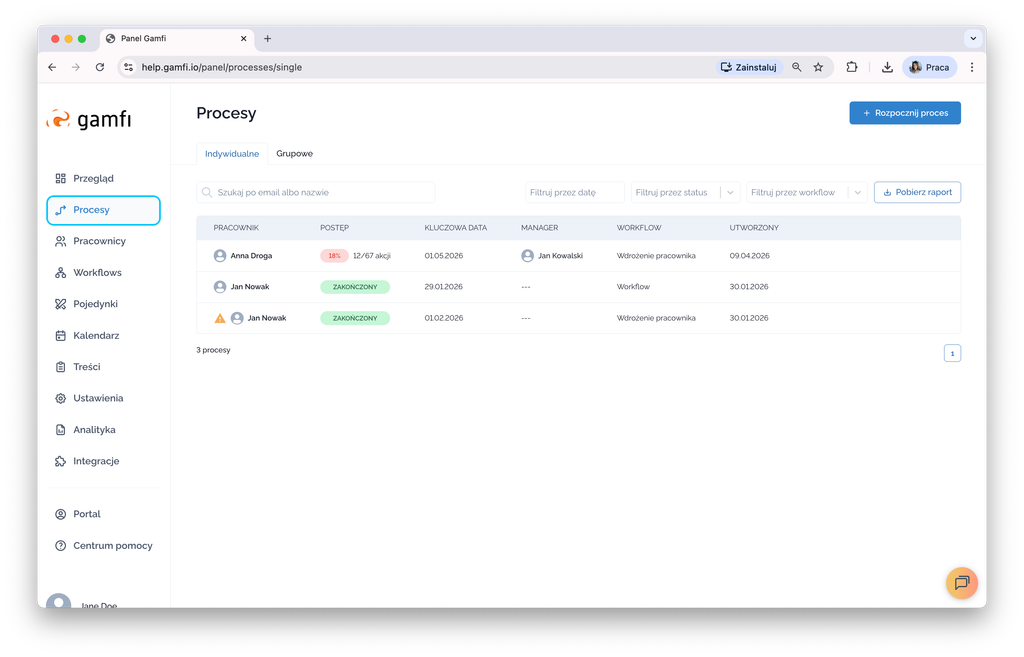
The table displays the following data:
- Name of the employee affected by the Process
- Progress of the Process with the number of Actions (performed / to be performed)
- Created Date (Date of Process Creation)
- Key Date
- Workflow - selected template for a running Process
- Manager - assigned to the Process Manager
There are 5 statuses of Processes:
-
Ongoing - marked by a green label with a percentage value
-
Ongoing but overdue - marked with a red percentage label
-
Paused - marked with an orange label that reads "paused"
-
Canceled - marked with an orange label that reads "CANCELLED"
-
Completed - marked with a green label that says "COMPLETED"
What does each status mean?
- Ongoing - the Process continues smoothly without reservation, all roles assigned to the Process perform their tasks on time
- Ongoing, but overdue - The process is ongoing, but some of the tasks for the Employee or Manager are overdue (not completed by the established deadline)
- Paused - The process has been stopped, all Action and information has been stopped and removed from the Employee Portal.
⚠️ The process can be resumed at any time.
- Canceled - The process has been canceled, all Actions and information have been stopped irretrievably and deleted from the Employee Portal.
⚠️ The process cannot be resumed again.
- Completed - The Process has been completed and all tasks passed by all roles in the Process (Employee / Manager).
What do the numbers next to ongoing statuses mean?
The numbers accompanying ongoing Processes (e.g., 18% 2/11 Actions) indicate how many Actions have been completed by the participants in the Process (Employee/Manager) and how many Actions count for the entire Process. Example: 18% 2/11 Actions:
- a total of 11 Actions are planned in the Process
- a total of 2 Actions were performed in the Process which is 18%
Do you need to export data of the processes?
Download the aggregate Process Report:
- Go to your Dashboard,
- go to the "Processes" tab,
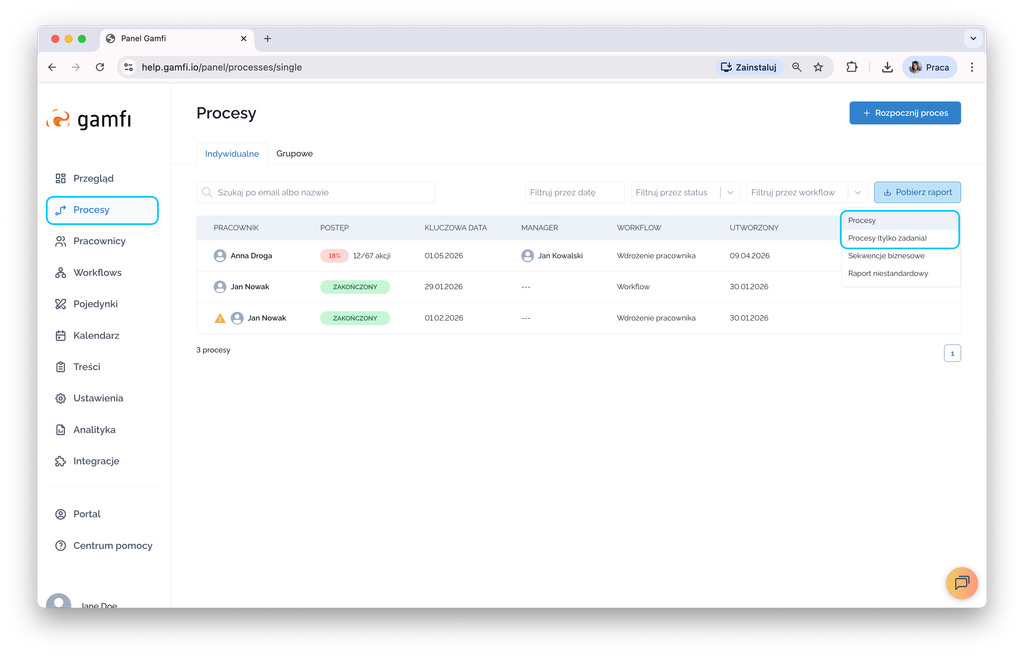
- click the "Download Report" button,
- then select "Processes" or "Processes (Tasks Only)" - in this case, the report omits Email and SMS Actions and shows only tasks.
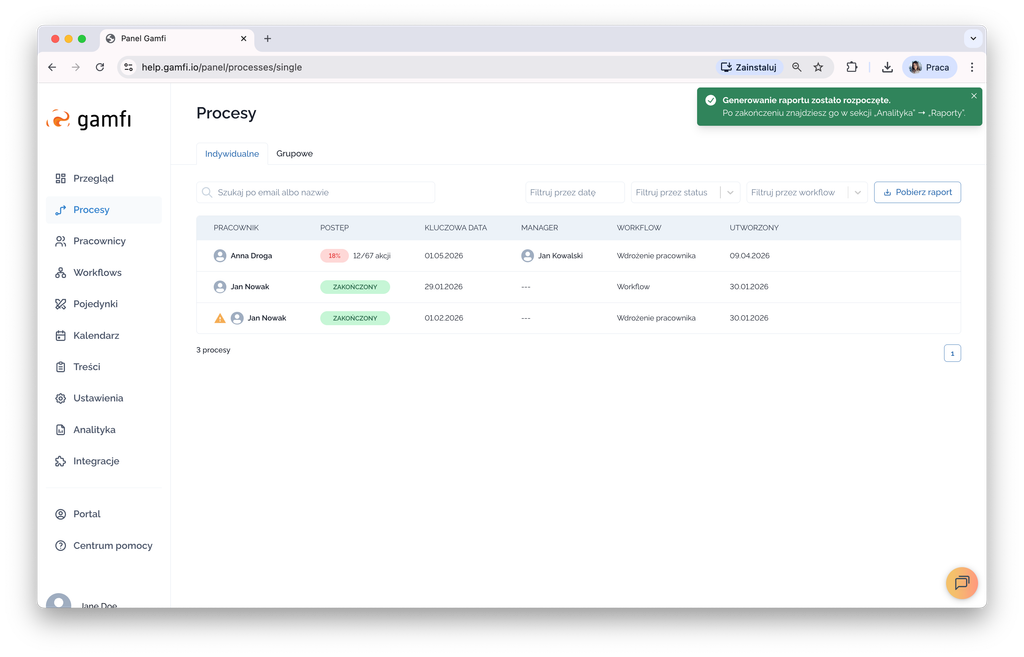
After a moment, a message will appear in the upper right corner: "Report generation has started. Once completed, you will find it in the "Analytics" > "Reports" section.
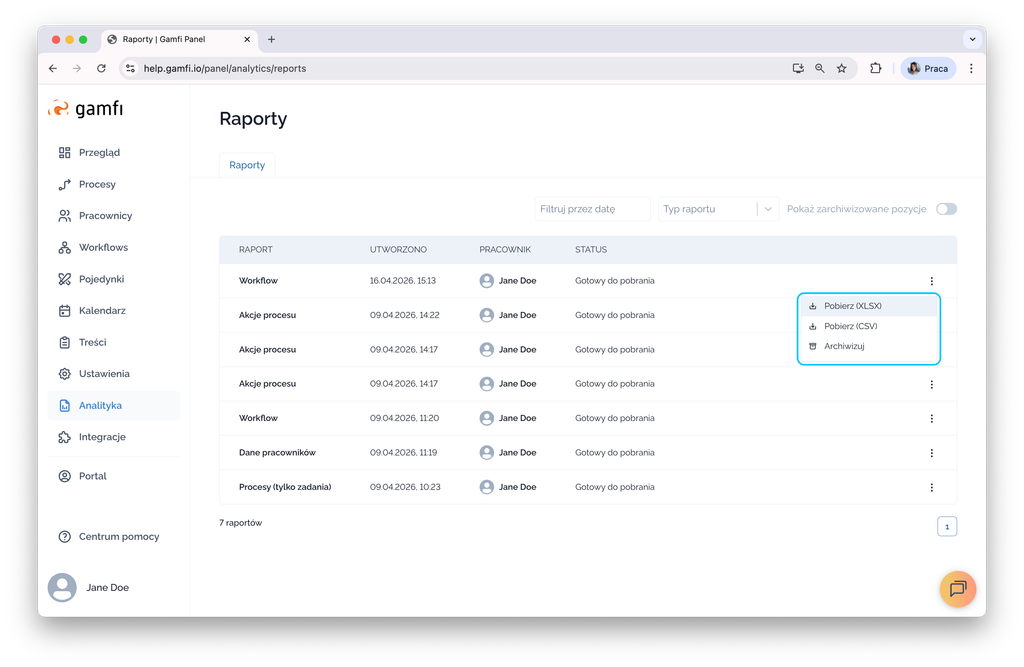
Once you see the "Ready to download" status in the "Analytics" > "Reports" tab, you can begin analysis. The report can be downloaded in XLSX or CSV format. You can also archive the report here.
![]()
Portal Report Downloaded by Role
To download a report of the processes in which a Role participates, go to the "Your Team" section and click "Processes." The Portal will generate and download an .xlsx file (Microsoft Excel) to your computer, listing all Actions in the Processes in which the Role participates.

⚠️ The report only applies to Processes to which you are assigned as a Manager or other Role.
How to analyze data in the report?
The document contains the following data regarding processes:
- Employee name - the name and surname of the specific employee being onboarded,
- Email - the email address of the onboarded employee,
- Workflow (name) - the name of the Workflow based on which the Process is launched,
- Workflow (category) - the Workflow category (e.g., Onboarding, Pre-onboarding, Offboarding, New Role),
- Created - the date the Process was launched,
- Key date - the key date for the Process; In the case of the onboarding process, this will be the first day of work.
- Status (delivered) - the number of Actions delivered in the process (how many Actions planned in a given process based on the workflow have already been delivered).
- Status (%) - the percentage of Actions delivered - relative to the Actions planned in the process (e.g., 10 Actions were released in the process, and 20 were planned - result: 50%).
- Progress (completion) - the number of Actions completed in the process.
- Progress (%) - the percentage of Actions completed - relative to the Actions delivered in the process (e.g., 10 Actions were delivered in the process, and 6 were completed - result: 60%).
- Employee (plan) - the number of Actions planned in the process.
- Employee (delivered) - number of Actions delivered to the employee,
- Employee (done) - number of Actions completed by the employee,
- Employee (%) - percentage of Actions completed by the employee - relative to the Actions delivered to them in the Process (e.g., 10 Actions were delivered in the Process, but the employee has only completed 6 of them so far - result: 60%),
- Manager - name and surname of the manager in the Process,
- Manager (plan) - number of Actions planned in the Process for the manager,
- Manager (delivered) - number of Actions delivered to the manager,
- Manager (done) - number of Actions completed by the manager,
- Manager (%) - percentage of Actions completed by the manager - relative to the Actions delivered to them in the Process (e.g., 10 Actions were delivered in the Process, but the manager has only completed 6 of them so far - result: 60%).
If other Roles (e.g., buddy) participate in the Process, in addition to the employee and manager, you'll also see data about them. They'll be displayed in a similar manner.